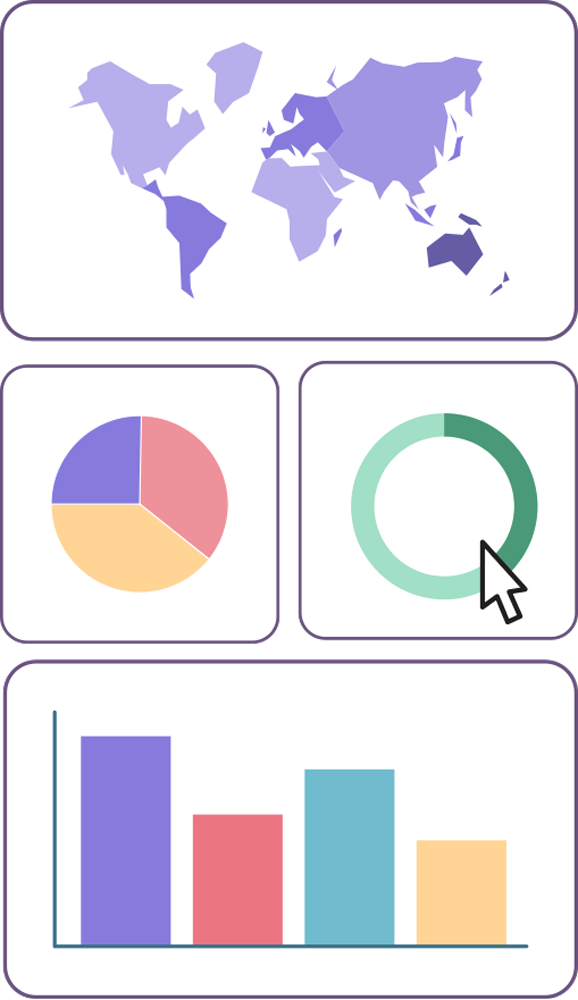
It’s designed for building inclusivity and wellbeing in the workplace
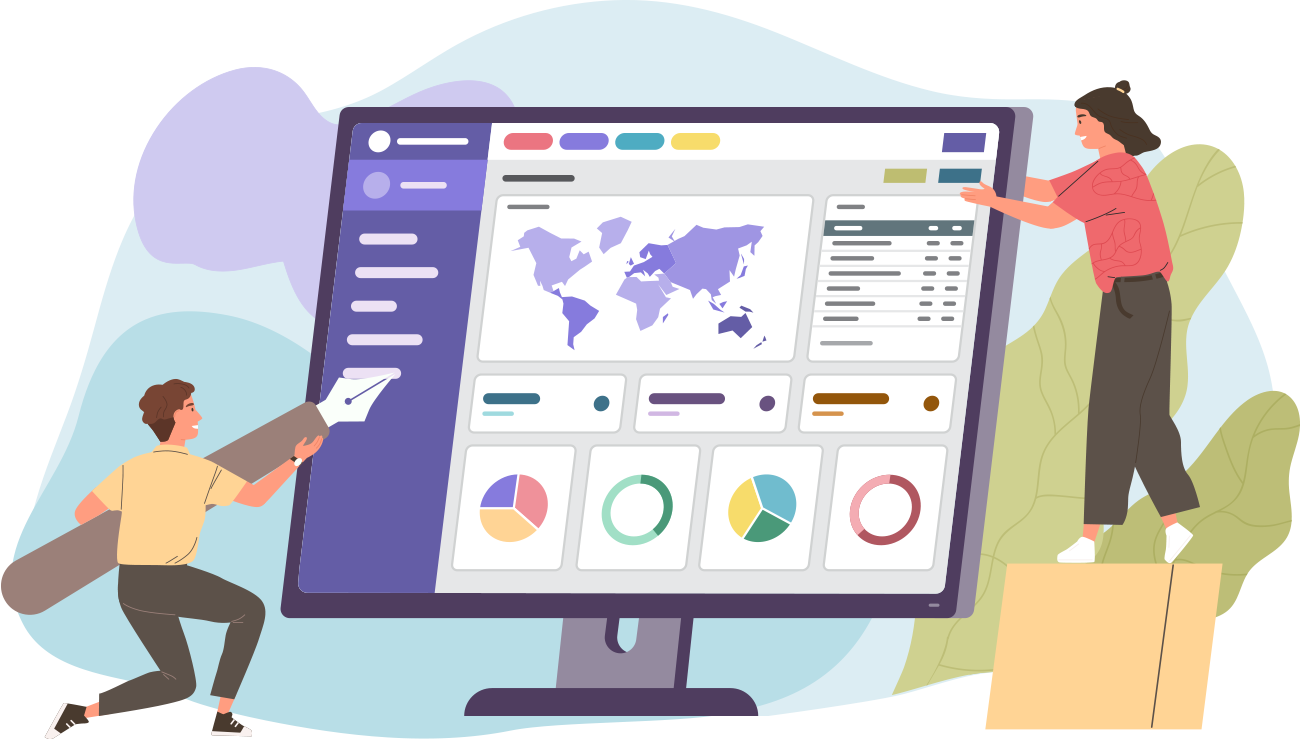
How it works
Measuring cultural diversity will enable your organisation to develop effective strategies for recruitment, inclusion and engagement based on your specific diversity makeup. By establishing a diversity baseline, you can then track changes to diversity across time to evaluate the impact of your strategies.To measure your workplaces’ teams is simple, fast and secure. Get your diversity data in a matter of minutes with no expertise in data analysis.
There are three simple stages in the process:
1. Discover

2. Develop

3. Deliver
What it measures
We emphasise both cultural and demographic diversity, and their intersectionality, in order to provide nuanced metrics which are useful for organisations. Our comprehensive survey is centered around the four pillars of culture: country of birth going back two generations, ethnicity, language and worldview/religion. Our detailed databases put people’s minority identities at the center. For example, imagine speaking Galician, a key part of your cultural identity, only to find it missing when completing forms or using software from businesses and governments. Diversity Atlas acknowledges every single worldview, ethnicity and language in the world.
The four pillars of culture are analysed intersectionality with key demographic factors such as gender, age, disability, sexual orientation, education, seniority level and more in great detail. This ensures you will understand the unique identity and lived experience of your people so you can transact and thrive in a diverse, complex and global environment.
The platform generates a comprehensive data profile, along with a unique weighted cultural diversity index, as a key measurement of your teams in your workplace to track changes in your diversity over time.
