ESG Reporting: Creating a standard diversity and inclusion data methodology
What is Social Diversity and Inclusion (SDI) Index?
The Social Diversity and Inclusion (SDI) Index is a world-first global metric for reporting on diversity and inclusion (D&I) within the ESG framework and is suitable for all organisations.
The scope of the SDI Index focuses solely on the D&I aspect of the Social reporting requirements of ESG, for which there is currently no global standard or defined ‘best practice’. It is designed to streamline this reporting option and bring clarity to results. Within ESG reporting the ‘S’ (Social) covers topics as vast as access to healthcare and modern slavery, and indeed, ‘Diversity & Inclusion’ is an optional reporting metric, but more and more, stakeholders, investors and staff alike expect organisations to address and report on D&I.
The SDI Index complements ESG reporting with quantitative information on D&I drawn from a combination of results from the Diversity Atlas platform and the existing HR data provided by participating organisations. The Diversity Atlas SDI Index is “global” in that it has been designed to accommodate all regions, however individual ‘by region’ reports may also be generated using the same metrics, whether by country, continent or any other geography.
It also offers a world-first ‘score’ for D&I commitment and results, but not all aspects of the report contribute to the score and are merely reporting options (for example: number of languages / dialects spoken within a cohort).
Our ESG reporting is compliant with EU Corporate Sustainability Reporting Directive and GDPR more generally. Further, tailoring the report to comply with all jurisdictions around the world is made possible with its agile framework and design.
Domains of the SDI framework
How does it work?
- Customers license and deploy Diversity Atlas to their staff / teams.
- Once completed, customers request a SDI report from their dashboard
- As part of the assessment, some HR data will be required – this is submitted using an online form
- The Diversity Atlas Anthrodata team will apply the criteria and calculate the score
- The customer will then select which specific areas / data points of the criteria they would like to report
- Diversity Atlas will deliver the final report – either ready for publication or for editing by customer’s own design team
How is the SDI Index calculated?
The SDI Index was developed over the course of 2024 by the Anthrodata team at Diversity Atlas, comprising a lead data scientist and subject matter experts (SMEs) across an array of fields such as anthropology, linguistics and DEI advocacy. Part of the research included a literature review studying examples such as the Global Peace Index, Gender Equality Index and the Australian Cohesion Index among others, all of which hold their own calculative approaches within their own domains; some are weighted, some are not.
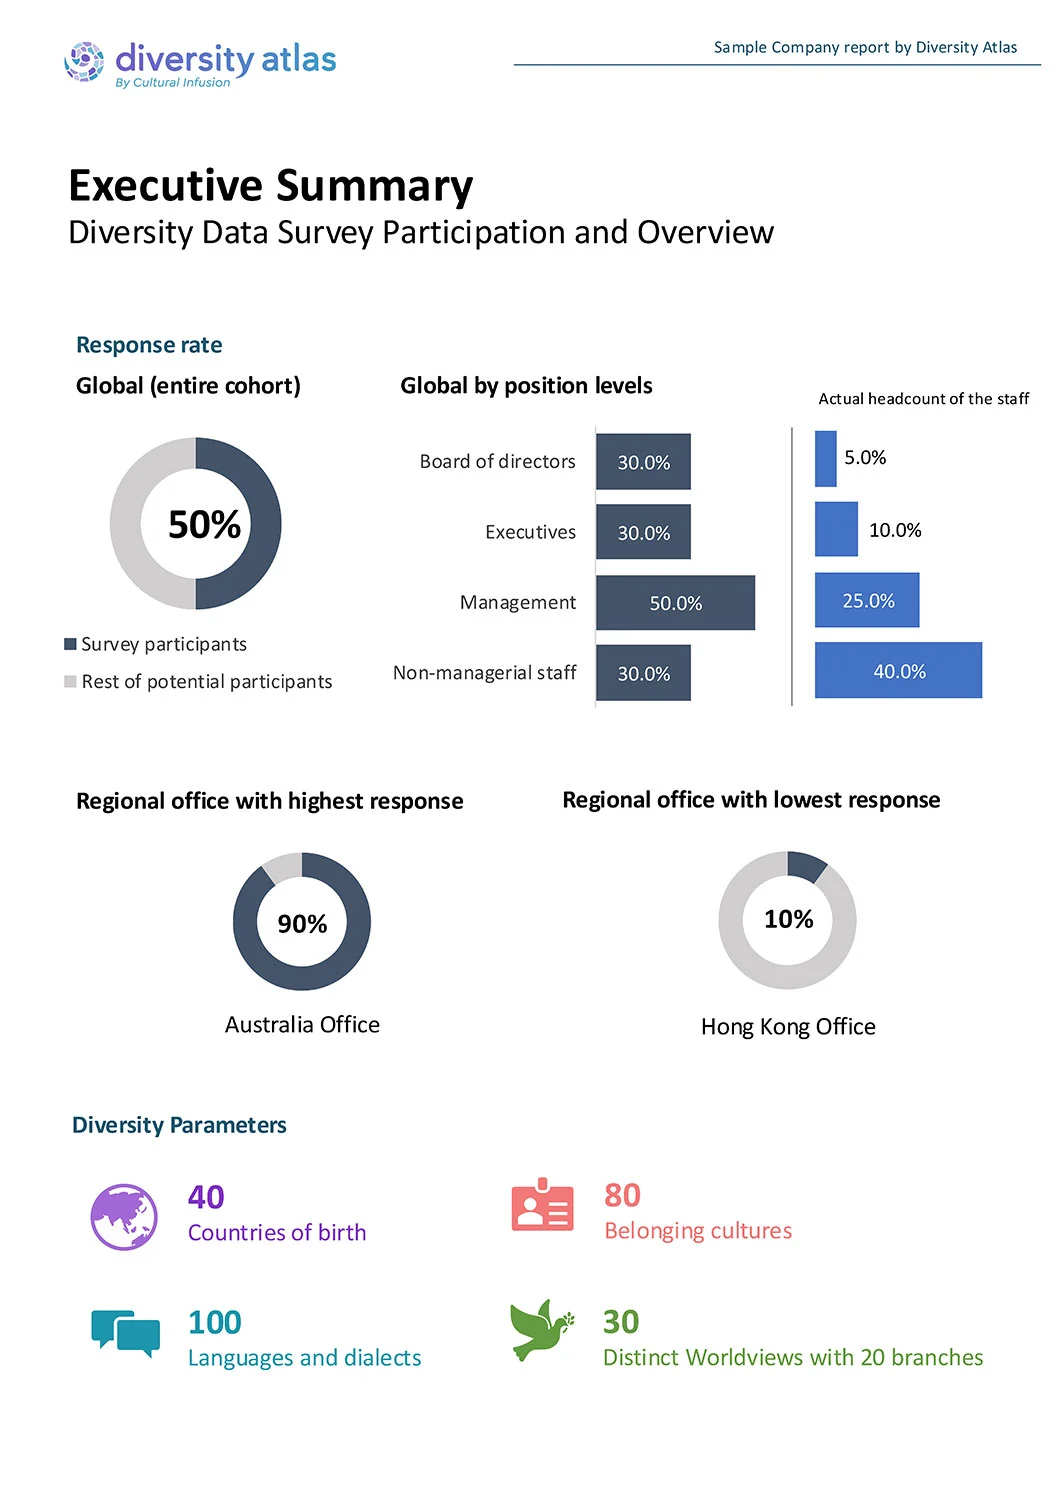
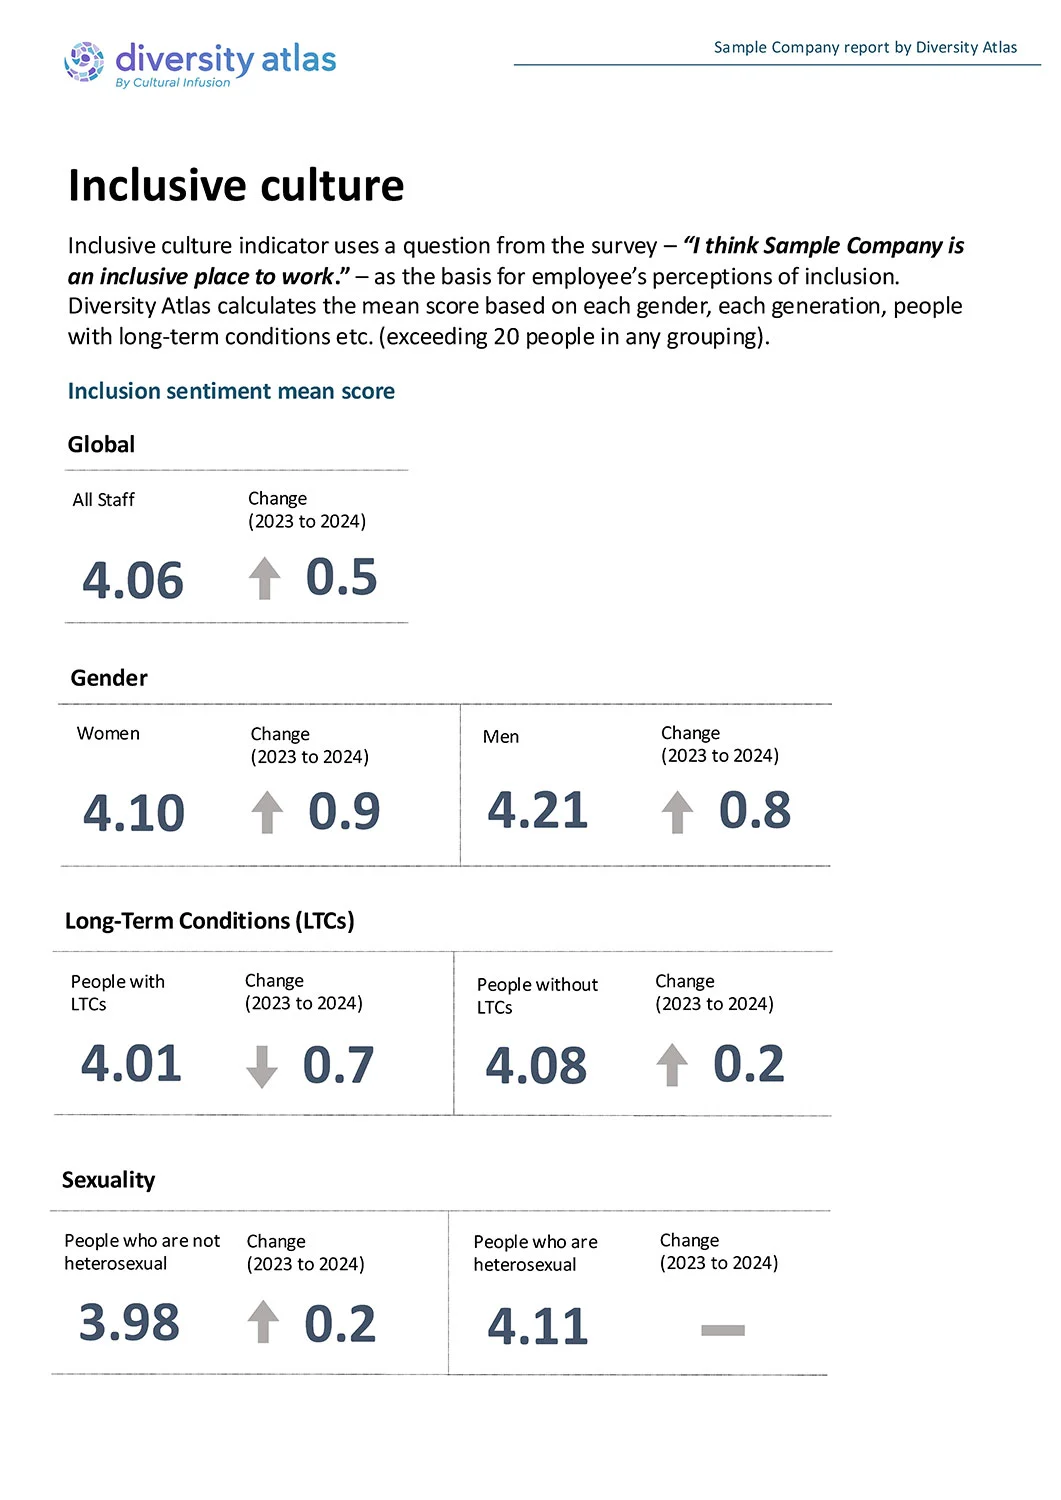
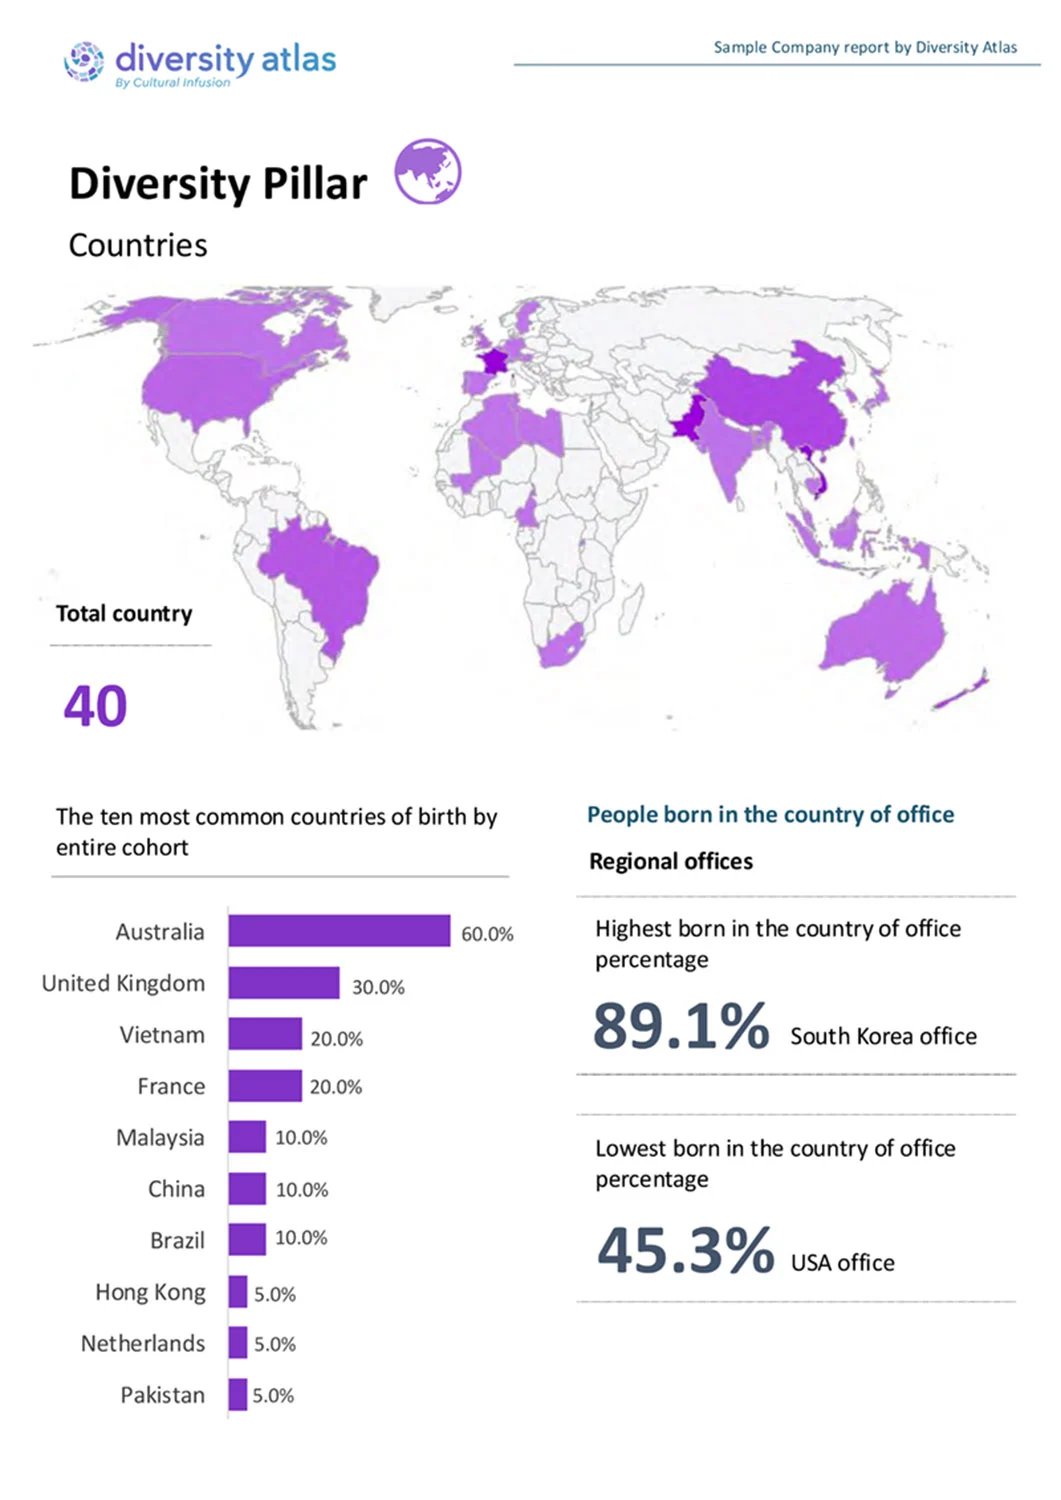
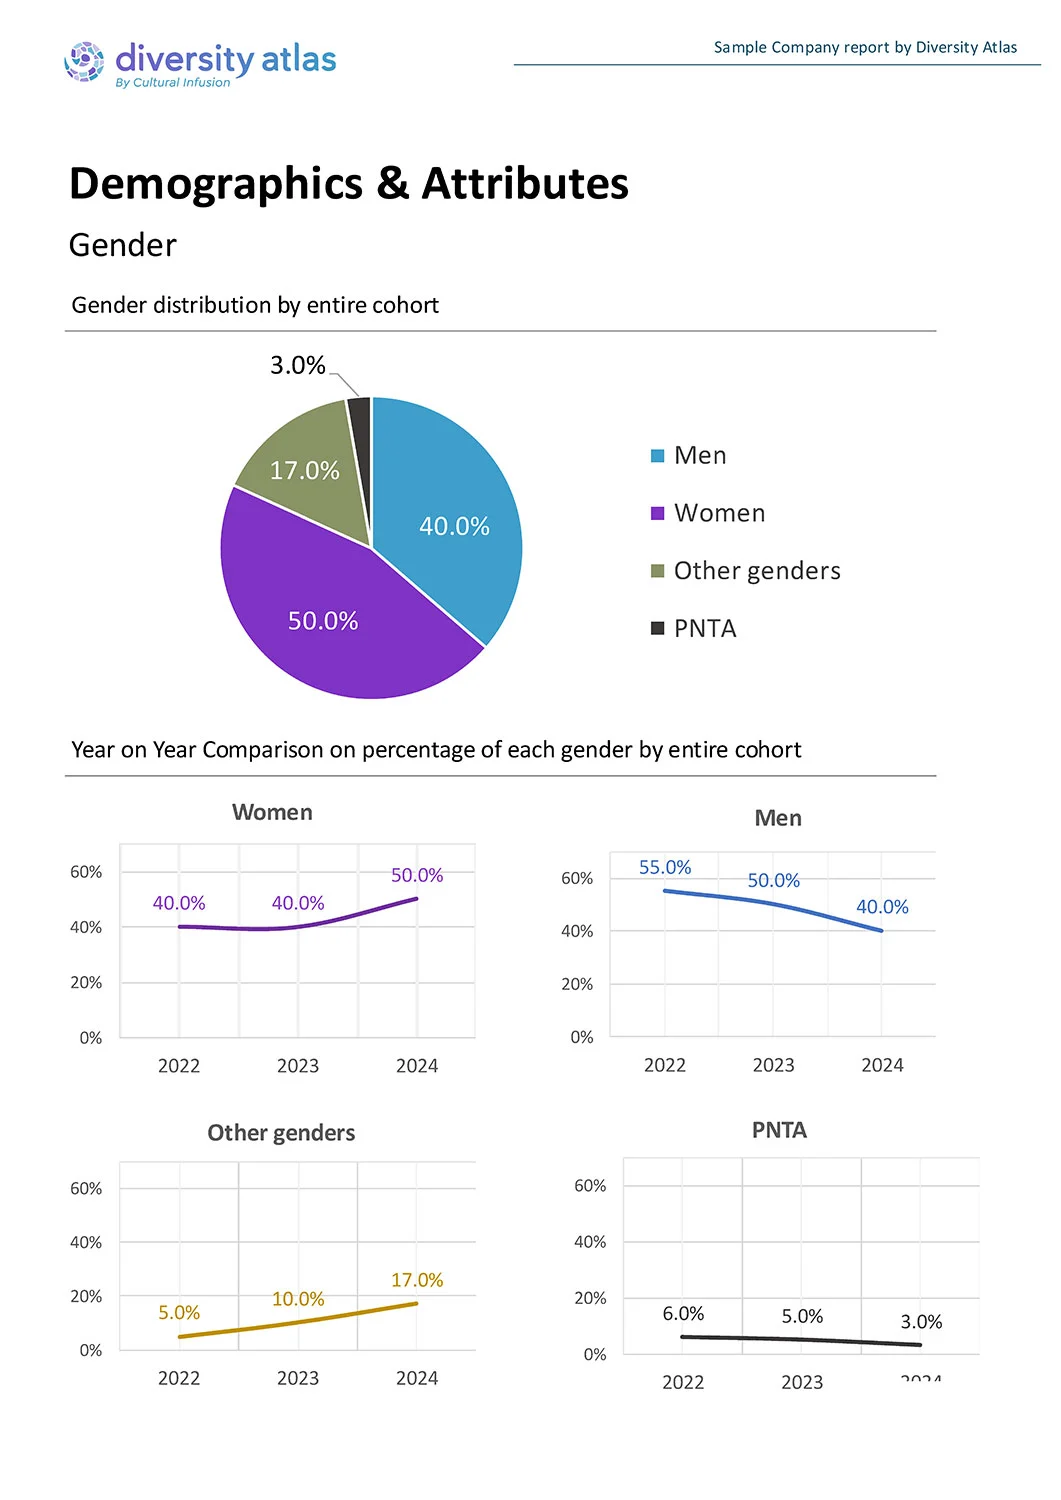
Our index is a score that is an easily interpretable measure of D&I as a complex multi-dimensional space, ripe for analysis across five pillars. It measures both the efforts to collect meaningful diversity data, and the results on Community Representation, Inclusion Sentiment, Proportional Representation, and Survey Cooperation.
Across these five pillars, the index is weighted. The weight (or relative importance) assigned to each pillar has been developed by Diversity Atlas’s Anthrodata Team. The index works on a scale from 0 to 10, with points allocated for meeting each scoring criteria in the pillars.
Cohort
- The SDI framework can be applied to either all your staff or just the leadership (as defined by the customers – for instance, it may just be the Board, however ‘Leadership’ definition can be expanded to include executive, C-suite and senior management).
- By request, a report for each can be produced, including a mutuality analysis between leadership and the whole cohort if both options are selected. It is our opinion that reporting on all staff must become the global standard of D&I reporting within the ESG framework, as Board representation will only ever tell a small part of the story around D&I.
- The report is customisable and may be edited down to suit customer’s reporting requirements.


