September 22, 2023

Benchmarking is here! Well, almost.
In February next year Diversity Atlas will start providing our customers benchmarking data. In the two years we’ve been running live I would say that it’s the most frequently asked frequently asked question (FAFAQ). “How do we compare to your other customers?” Well, we have enough of them now to be able to provide some answers so long as each customer is happy to have their data pooled (anonymously, of course).
A benchmark is simply an observation from which comparisons can be made.
4 Types of Benchmarking and 18 Metrics
We’re offering four types of benchmarking. The first is internal benchmarking between an organisation’s groups (by region, or function for instance), and the other three are external based on either / all of country, industry or cohort size.
As for what we’re benchmarking, well, we have at the moment 18 metrics, ranging from the ol’ classic ‘participation rate’ to ‘percentage of staff with long-term conditions / disability’ and my personal favourite, ‘PNTA’ (prefer not to answer’) percentages on questions such as sexuality and religion.
There is No ‘Better’
We haven’t settled yet on the colours, but here’s a sneak preview. In the graph below we are looking at a group or company’s response rate (i.e. what percentage of their staff did the survey).
We can see the median, the 10th and 90th percentile (shaded grey), and the selected group (C) “You Are Here” benchmark found at the high end of the interquartile range.

Interestingly, when considering response rates we could certainly make a case that ‘the higher the better’ but as with many other measurements, there is no ‘better’, there is only ‘difference’ and ‘variation’. Let’s now look at this same organisation on behalf of Customer “C” at the percentage of their staff that identified as not heterosexual, using the anonymised YAH chart.

The fact that this mythical company C is right on the median is neither a good nor bad thing, it’s just a thing for observation and reflection.
In a way, organisations that provide benchmarking of things like profits have it easy – the bigger the better – but Diversity, Equity and Inclusion (DEI) is a different world and bigger (or smaller) is not always a better thing. Unlike metrics such as profits or gold medals, many of the diversity metrics we count should not be considered a race to the top, as it were. Considerations of how closely a group’s profile is representative of their community is essential analysis to make alongside our benchmarking data.
It’s not just human nature, it seems to be organisational nature to want to know how they measure up and compare with others. There’s a wisdom in telling people and companies to not worry about what others are up to, just keep your own selves in order, and do your thing. What matters most is that ‘your thing’, whatever it is, is productive, bettering, fun and safe, and if you gather data on yourselves, what really matters is what you do with the data; and never mind what the others are up to. But that’s just not how we’re wired, and in fact, there will be benefits in making comparisons with external data sources because anomalies will appear and that will lead to opportunities and growth.
Steak Knives
But that’s not all! Now that we can pool data (with permission) we’re also adding in some extra compare features. We already have compare features built into our dashboard that enable customers to compare diversity data between their groups, as well as census data, but, we’re adding to that suite ‘pooled’ comparison data from all our consenting customers.
Below is an example of a Likert scale response to an ‘inclusion sentiment’ query (wording variable); e.g. as to whether the organisation is inclusive / welcoming of difference and diversity.
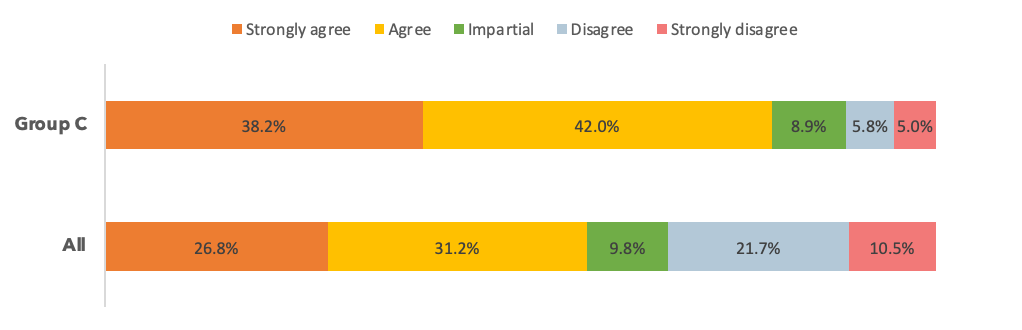
Again, I’m not sold on the colours.
If you want to have a chat about Diversity Atlas, hit me up via [email protected] or straight to me at [email protected]
About the author:
Share this Post
If you'd like to get in touch and experience a one on one demo of Diversity Atlas.
Book a Demo