It goes without saying that a great deal of time has been afforded to discussing the outputs and consequences of a diversity and inclusion strategy. I find it interesting, however, that in my experience what is often called into question is the precise fundamental need for such strategies. I’ve seen it many times: professionals feeling that it is not always clear why such strategies are needed, and silently struggling to understand how they translate to tangible benefits for an organisation. Yet the fundamental key to an efficient D&I strategy – and all planning activities in business – is to approach the design of strategies first and foremost with a clear idea of their necessity, by first exploring the why.

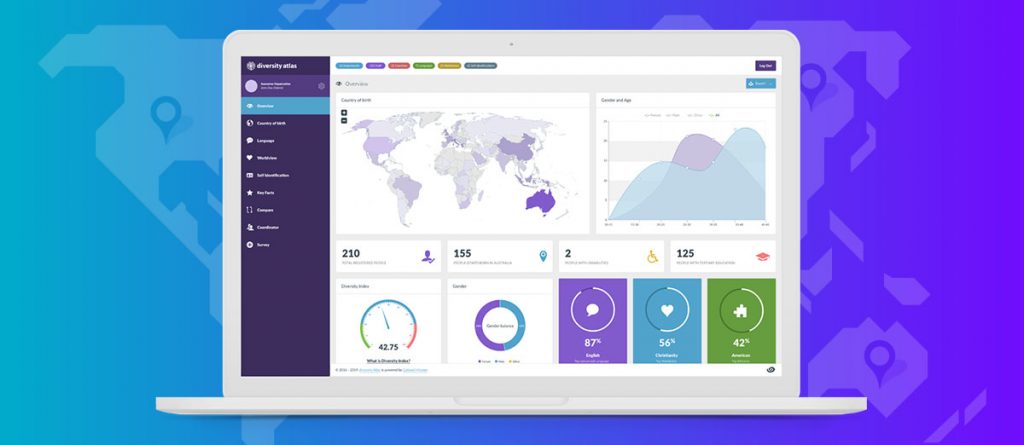
Diversity Atlas is considered the first knowledge tool that measures and benchmarks cultural diversity within teams and organizations.
Diversity in its most commonly understood definition reflects the disparity among a group of people based on different aspects. These aspects might span a person’s language, ethnicity, worldviews, abilities, education level, ancestry etc. This disparity then inculcates the expression of diversity in thoughts, views, and perspectives of different people towards their job.
But disparity alone is inefficient in eliciting what we understand to be the benefits of a diverse workforce. Diversity without inclusion is effectively toothless, as inclusion is what brings out an individual’s capability to impart their knowledge and skills effectively unto the rest of the organisation (Ahmad et al., 2019).
I recently attended the 2019 FECCA conference. At the very same conference, Labor MP Andrew Giles mentioned the importance of more detailed data in the Australian census. There is a need to update the national census of Australia, so that the exact picture of Australia’s ethnic population can be better understood, and so that its potential can be utilised for the over betterment of the nation. It was quite fitting that this observation was followed by Martin and I presenting Diversity Atlas, while the CEO of FECCA presented infographs generated by Diversity Atlas to map the cultural diversity of delegates who attended at this event. The full report produced results that thoroughly surprised the conference organisers, who even from their vantage could have only a cursory understanding of the conference’s demographics.

This exercise in empiricism is but one demonstration of how stark the gap is when it comes to clear, measurable, evidence-based understandings of diversity and D&I strategies. It is a given that evidence-based strategies are the key to exploring the talent and potential constituted by these individuals, based on carefully analysed metric data. Quota based metrics, for instance, work as a measurement tool that can identify the number of people belonging to a certain group based on particular ‘diversity aspects’. Before booking your next team building exercise, know that building an inclusive culture is only made possible through careful thought, design, empiricism and planning.
The Importance of Data Analytics in Diversity and Inclusion Strategy (D&I)
Data and analytics play a very significant role in driving successful D&I strategies. Understanding the measures and actions taken in a D&I program depends on this quantitative and qualitative data. Within an organisation, one needs to be aware of the cultural context of an employee as it may help uncover hidden traits that are of benefit to the organisation. This enables the organisation to develop realistic goals that are impactful and meaningful to attain success and growth (McEvoy, 2019).
One such instance took place in IKEA, where the Global D&I Matrix Leader Dr. Tie Wang-Jones (PhD, organisational psychology/clinical psychology) shared her experience facing the challenges of collecting accurate data that can be effectively analysed and placed at the core of the initiatives of their diversity program. She stated that, while screening resumes, IKEA chose to remain unaware of a candidate’s gender, race or age. Although implemented with well-meaning intent, the resulting data gap was a substantial obstacle towards measuring the outcomes and performance of IKEA’s D&I global program. This problem remains unresolved as IKEA is still looking for a technological solution to attain such exclusive data (Advisory, 2019).
An organisation equipped with evidence-based diversity and inclusion strategies embarks on its path to success by obtaining the benefits of exploring diverse ideas and perspectives, along with inclusive efforts of diverse groups that create a global output. Although to attain such a cooperative environment, the diverse groups are needed to be managed. Only then will local customers be attracted to the purpose of the business (CiuCiu, 2019). Team building in a diverse environment is also key to creating an impact on the audience coming from different demographics, cultures, and backgrounds. The leaders of Diversity and Inclusion are aware of the importance to build a realistic D&I strategy so that massive opportunities available in the market could be grabbed (Weaver, 2019).

So how to measure Cultural Diversity?
Innovative social enterprise Cultural Infusion has spent several years developing Diversity Atlas – a new software platform that helps organisations answer these questions. It can provide important insights for those looking to improve the way they support staff and community.
What is Diversity Atlas?
Diversity Atlas is a diversity data-analysis tool that provides insight into cultural and demographic diversity within an organisation. It allows organisations to understand the diversity of their workforce, compare it to the community or target market, and benchmark changes over time. It produces insights immediately, via reports and infographics, in an easy to understand manner.
Why is measuring diversity important?
Diversity leads to a range of benefits for businesses, organisations, and government. For businesses, diversity is linked to increased profitability, better decision making, and better customer insight. For government, diversity of workforce that is representative of the community leads to higher levels of trust of government institutions (such as the police), enhanced social integration and better outcomes such as health, education and more.
But to achieve these benefits, organisations need to understand the variety, balance, and distribution of diversity across their organisation or consumer group—and that is what Diversity Atlas does. Diversity Atlas is a diversity dashboard that provides a simple, anonymous and encrypted way of collecting sensitive cultural and demographic data, which then produces business insights.
Diversity Atlas enables organisations to:
- Measure the variety of diversity across their workforce or beneficiaries (cultural, demographic and more)
- Analyse the balance of diversity (by comparing their diversity profile to the community to understand their diversity gaps)
- Understand the distribution of diversity (across function and level) in their organisation.
Types of diversity measured in Diversity Atlas:
Cultural
- Country of birth going back 3 generations
- Languages
- Ethnicity
- Religion and worldview (i.e religious and secular worldviews)
Demographic:
- Age
- Gender
- Education
- Disability
- Position type and level type
- Race
- Sexual orientation
- Other fields can be added upon request
It is leaders who need to take ownership of and be accountable for diversity initiatives, not HR
Peter Mousaferiadis, CEO of Cultural Infusion , Rhodes, 2019
Share this Post